
In previous articles we have discussed how to import an entire table from SQL Server to Excel and we have used the MSQuery tool to filter and load only the relevant records from an SQL server table before retrieving them to Excel.
Today we are going to unleash the real power of MSQuery. We are going to use MSQuery to join data from separate database tables into one excel sheet – thus enabling you to create any report you want from your SQL Server data.
But first why do we need to join data from different tables at all?
Why You Need to Join SQL Tables
SQL queries that join tables are super important. This is because more often than not the data you need for your report will not be found in one single table.
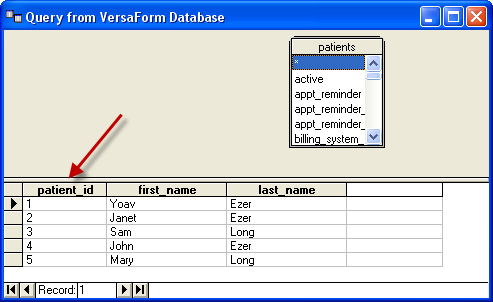
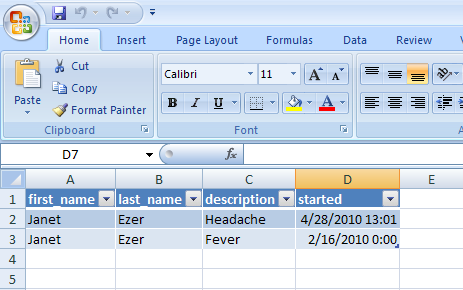
For instance, if we wanted to make an Excel report listing the doctor visits each clinic patient had in the last year, we would need to retrieve data from both the [patients] table and the [encounters] table.
You might ask “But why is the data split between the two tables in the first place? Why did the application designers put the visits data in a different table? Why not put it all in the [patients] table?”
Well… This is because databases are not designed for ease of reporting. They are designed for flexibility, maintenance and for making sure that the data is correct, well organized and consistent.
Consider what would happen if we were to add the fields that describe a visit to the [patients] table (fields like date of visit, attending doctor, cause of visit) then we would be able to document only one visit for each patient.
I know, I know… we could add multiple visit date fields and multiple visit compliant fields and so on and this way we could document many visit.
But how many visit-date fields would you add 10,20 a hundred?
What happens if one patient makes more than the number of visit fields we initially put in the table. In this case we would have to change the database structure to support more visits for each customer. We would also have to change the software so that it ‘knows’ there are more fields in the [patients] table.
This makes the database very inflexible and makes the entire application much harder to maintain and support.
That is why when designing a database, database designers go through a process of ‘normalization‘ which makes sure that the database is as flexible as possible and that data-integrity is maintained throughout the database (Only one version of a specific data item is maintained at all times).
But you don’t have to understand database design or normalization at all. All you have to do is understand one simple key principle…
The Key to Combining Data from Multiple Tables
The key is to understand that every record of data in a database table is uniquely identified. Each row can be referenced by a unique number. This unique number identifies the record the same way a fingerprint uniquely identifies every human being.
This unique identifier is called a primary key.
For instance, the primary key in the [patients] table is [patient_id]
Each table in the database has its own primary key.
Using Database Keys to Join Tables
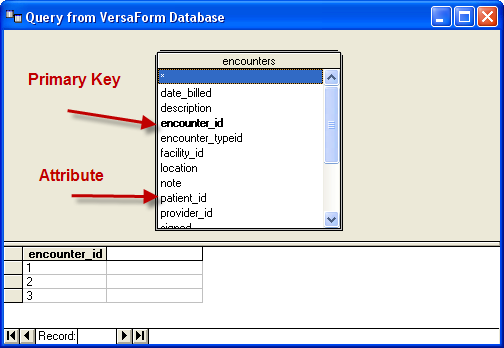
The second key principle you have to understand is that a primary key in one table can be an attribute in another table.
For instance, in the [encounters] table, [patient_id] is used as an attribute and not as a primary key.
So in order to get a list of all the visits (encounters) that a patient had we need to query both the [encounters] table and the [patients table].
Fortunately for us, MSQuery knows how to combine tables automatically, all we need to do is select both of the tables inside of MSQuery and the tool will connect the tables on its own.
How to Use MSQuery to Create Joined Table Reports
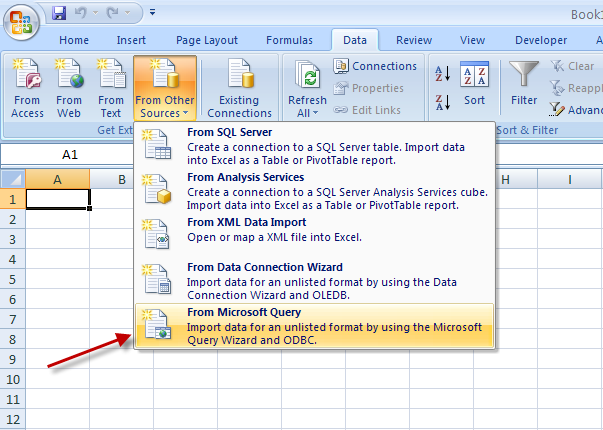
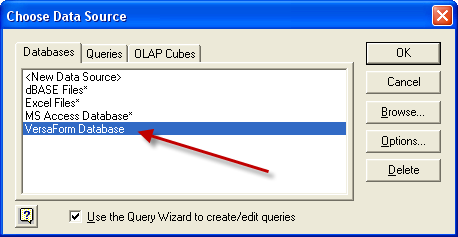
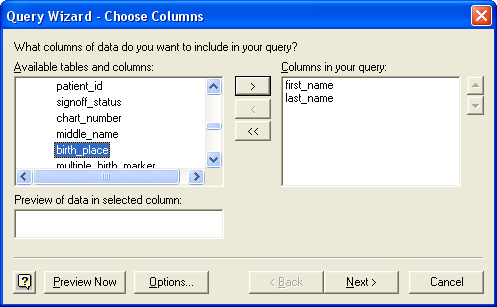
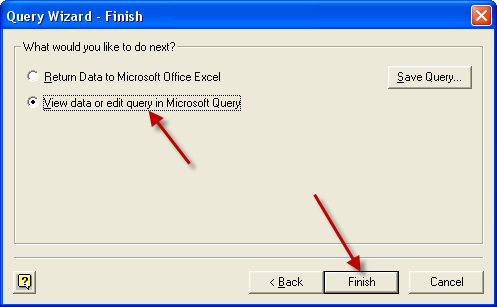
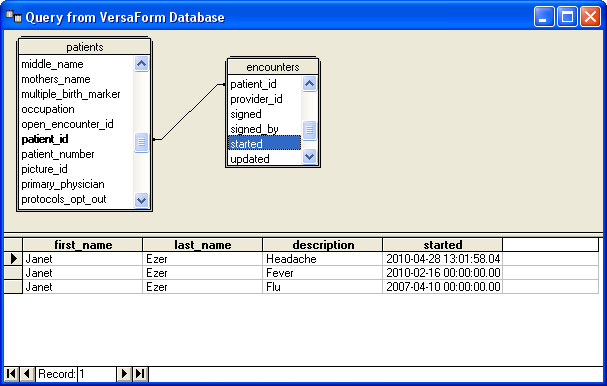
First we start by creating a new MSQuery report:

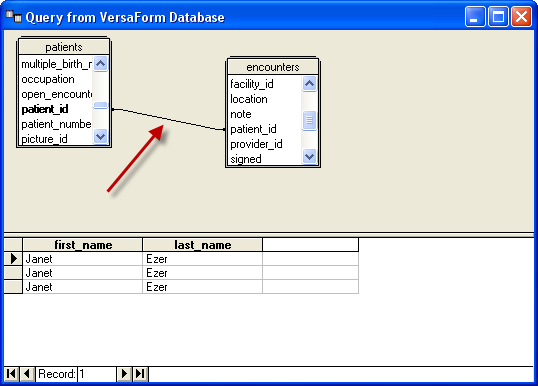
Now, if we add fields from the encounters table, these fields would be correctly joined to the right record in the patients’ data.
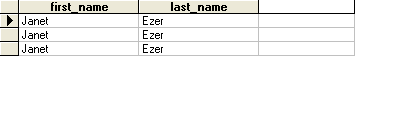
It is also important to know that once we add two or more tables that are joined by a common key, MsQuery will show only records from that have entries in both tables.
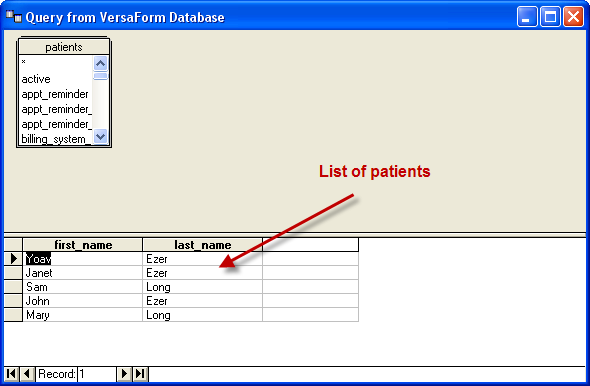
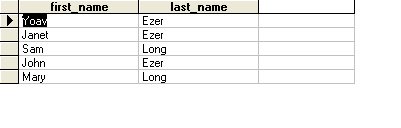
For example, when we first started the query and added only the [patients] table, MSquery showed us the entire patient list…
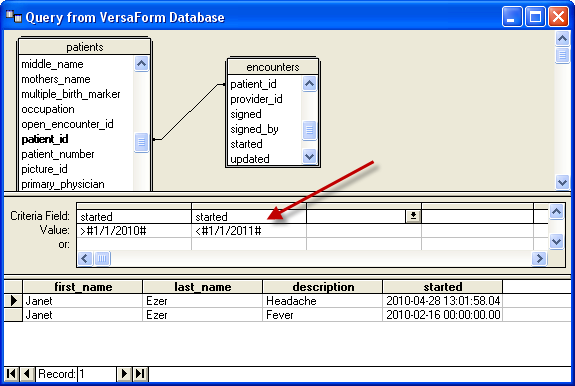
And finally, we do what we set out to do in the beginning and add fields from the encounters table to the query. We do so by double clicking the field names in the encounter table or by dragging them into the query list area.
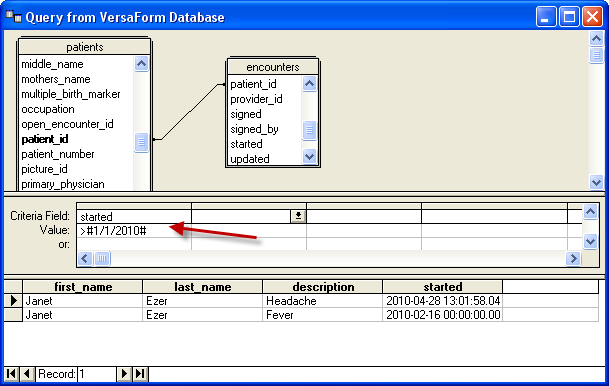
To do that we need to click on the ‘Show filters button’ in the MSQuery toolbar:

Summary
Once you master loading data from multiple database tables the full world of SQL queries and reporting is at your fingertips. Hopefully this brief article will give you an idea of the untapped potential waiting for you to discover, and help you bring this powerful feature to your spreadsheets.
P.S.
And, as usual, don’t forget to check out our PDF to Excel Converter. It can help you free up a lot of time. Time you can use to get a lot more done at work or in your personal life…